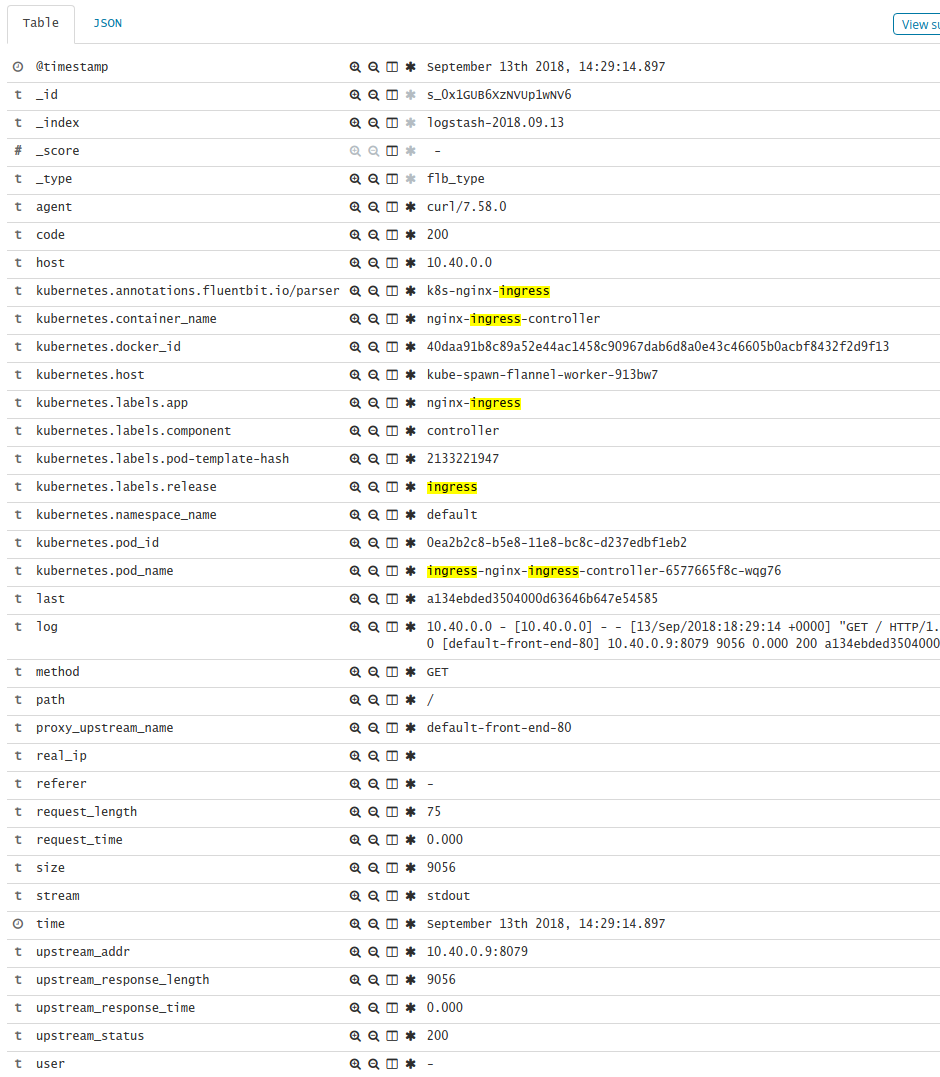
Like most cloud folks you are probably using Kibana + Elasticsearch as part of your log management solution. But did you know with a little regex-fu you can make that logging more interesting? See the kibana expansion in the image, the URI, host, service, etc are all expanded for your reporting pleasure.
First, lets install our ingress with some annotations. I’ve made the interesting bits red.
helm install stable/nginx-ingress --name ingress \
  --set controller.service.externalTrafficPolicy=Local \
  --set rbac.create=true \
  --set controller.podAnnotations.fluentbit\\.io/parser=k8s-nginx-ingress
If your ingress is already running you can use this instead:
kubectl annotate pods --overwrite ingress-nginx-#### fluentbit.io/parser=k8s-nginx-ingressNow, lets install fluent-bit (to feed the Elasticsearch). We will add a custom-regex for the nginx-ingress log format. Its not the same as the nginx default so we can’t use the built-in.
image:
fluent_bit:
repository: fluent/fluent-bit
tag: 0.14.1
pullPolicy: IfNotPresent
metrics:
enabled: true
service:
port: 2020
type: ClusterIP
trackOffsets: false
backend:
type: es
forward:
host: fluentd
port: 24284
es:
host: elasticsearch
port: 9200
index: kubernetes_cluster
type: flb_type
logstash_prefix: logstash
time_key: "@timestamp"
http_user:
http_passwd:
tls: "off"
tls_verify: "on"
tls_ca: ""
tls_debug: 1
parsers:
enabled: true
regex:
- name: k8s-nginx-ingress
regex: '^(?<host>[^ ]*) - \[(?<real_ip>)[^ ]*\] - (?<user>[^ ]*) \[(?<time>[^\]]*)\] "(?<method>\S+)(?: +(?<path>[^\"]*?)(?: +\S*)?)?" (?<code>[^ ]*) (?<size>[^ ]*) "(?<referer>[^\"]*)" "(?<agent>[^\"]*)" (?<request_length>[^ ]*) (?<request_time>[^ ]*) \[(?<proxy_upstream_name>[^ ]*)\] (?<upstream_addr>[^ ]*) (?<upstream_response_length>[^ ]*) (?<upstream_response_time>[^ ]*) (?<upstream_status>[^ ]*) (?<last>[^$]*)'Once this is done you’ll have something like below in your logs. See how all the fields are expanded to their own rather than being stuck in log: ?
{
  "_index": "logstash-2018.09.13",
  "_type": "flb_type",
  "_id": "s_0x1GUB6XzNVUp1wNV6",
  "_version": 1,
  "_score": null,
  "_source": {
    "@timestamp": "2018-09-13T18:29:14.897Z",
    "log": "10.40.0.0 - [10.40.0.0] - - [13/Sep/2018:18:29:14 +0000] \"GET / HTTP/1.1\" 200 9056 \"-\" \"curl/7.58.0\" 75 0.000 [default-front-end-80] 10.40.0.9:8079 9056 0.000 200 a134ebded3504000d63646b647e54585\n",
    "stream": "stdout",
    "time": "2018-09-13T18:29:14.897196588Z",
    "host": "10.40.0.0",
    "real_ip": "",
    "user": "-",
    "method": "GET",
    "path": "/",
    "code": "200",
    "size": "9056",
    "referer": "-",
    "agent": "curl/7.58.0",
    "request_length": "75",
    "request_time": "0.000",
    "proxy_upstream_name": "default-front-end-80",
    "upstream_addr": "10.40.0.9:8079",
    "upstream_response_length": "9056",
    "upstream_response_time": "0.000",
    "upstream_status": "200",
    "last": "a134ebded3504000d63646b647e54585",
    "kubernetes": {
      "pod_name": "ingress-nginx-ingress-controller-6577665f8c-wqg76",
      "namespace_name": "default",
      "pod_id": "0ea2b2c8-b5e8-11e8-bc8c-d237edbf1eb2",
      "labels": {
        "app": "nginx-ingress",
        "component": "controller",
        "pod-template-hash": "2133221947",
        "release": "ingress"
      },
      "annotations": {
        "fluentbit.io/parser": "k8s-nginx-ingress"
      },
      "host": "kube-spawn-flannel-worker-913bw7",
      "container_name": "nginx-ingress-controller",
      "docker_id": "40daa91b8c89a52e44ac1458c90967dab6d8a0e43c46605b0acbf8432f2d9f13"
    }
  },
  "fields": {
    "@timestamp": [
      "2018-09-13T18:29:14.897Z"
    ],
    "time": [
      "2018-09-13T18:29:14.897Z"
    ]
  },
  "highlight": {
    "kubernetes.labels.release.keyword": [
      "@kibana-highlighted-field@ingress@/kibana-highlighted-field@"
    ],
    "kubernetes.labels.app": [
      "nginx-@kibana-highlighted-field@ingress@/kibana-highlighted-field@"
    ],
    "kubernetes.annotations.fluentbit.io/parser": [
      "k8s-nginx-@kibana-highlighted-field@ingress@/kibana-highlighted-field@"
    ],
    "kubernetes.container_name": [
      "nginx-@kibana-highlighted-field@ingress@/kibana-highlighted-field@-controller"
    ],
    "kubernetes.pod_name": [
      "@kibana-highlighted-field@ingress@/kibana-highlighted-field@-nginx-@kibana-highlighted-field@ingress@/kibana-highlighted-field@-controller-6577665f8c-wqg76"
    ],
    "kubernetes.labels.release": [
      "@kibana-highlighted-field@ingress@/kibana-highlighted-field@"
    ]
  },
  "sort": [
    1536863354897
  ]
}
Leave a Reply to Naseem Cancel reply