So one of the upstream projects I am working on has added some new tests. Should be a good thing, right?
Suddenly, out of nowhere, we start getting ‘terminated 137’ on CI stages. The obscure unix math is… substract 128 to get the signal. So kill -9 (see here for why, tl;dr: 8-bit, 0-128==normal return, 129-255==abnormal return).
OK, lets talk about how we run this. We are using Gitlab-CI with gitlab-runner with Kubernetes executor. This means that our jobs scale with our Kubernetes clusters. For the ‘big’ things, we have a big node (2 x 18C36T w/ 256GiB). That’s right, 72 cores and 256GiB of non-oversubscribed system. You would think this be enough for the average codebase.
But then enters Bazel. The big fat java-based bully of the build playground. And it consumes… 46G of VIRT and 3G of PHYS just to manage things, and about 2 full time processors. But still we got space.
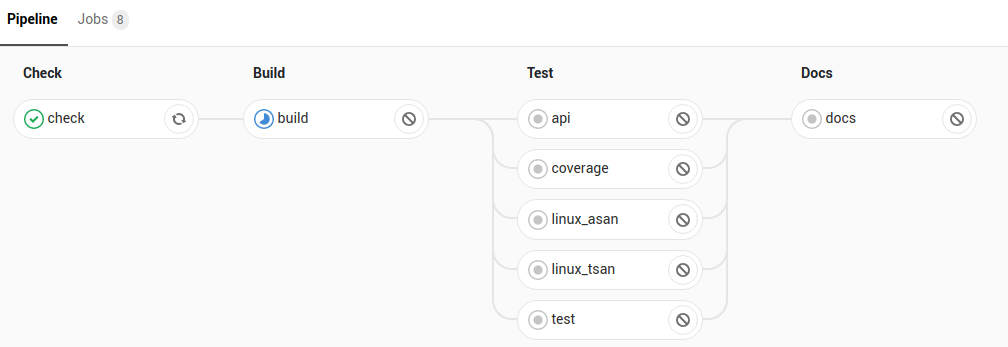
And then of course we parallel some of the stages. See in the image for what we allow to parallel. But, the linux_asan, linux_tsan, test are the big 3 (all running the same suite with different sanitizer flags).
OK. We are not getting OOM messages. So we are not out of memory. And a ton of graphing with vmstat and netdata prove that hypothesis. But that is the expected reason for a kill -9. Hmm.
If we look at top during one of the runs, we see the not-yet-too-common ‘t’ size. That’s right, two of the things have malloc’d 20TiB of memory. Hmm.
  PID USER      PR  NI    VIRT    RES    SHR S  %CPU %MEM     TIME+ COMMAND
49444 root      20   0 46.130g 2.634g  21152 S 124.6  1.0  12:22.89 java
  742 root      20   0  759984 676364  61752 R 100.0  0.3   0:12.71 clang-7
  760 root      20   0  745848 663384  62004 R 100.0  0.3   0:12.68 clang-7
 2344 root      20   0 20.000t 234276 147720 R  64.9  0.1   0:01.98 server_test
 2362 root      20   0 20.000t 226140 136812 S  61.6  0.1   0:01.88 websocket_integ
 2371 root      20   0  200628 125832  54136 R  60.7  0.0   0:01.85 clang-7
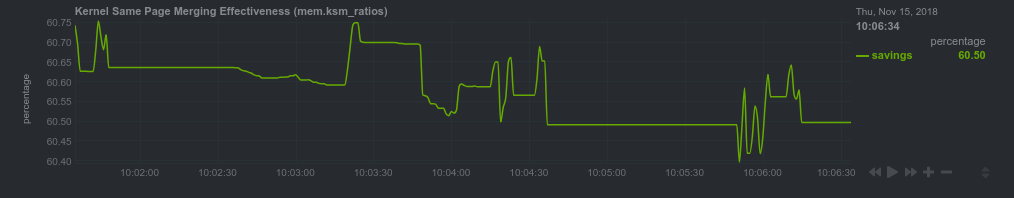
We dig a bit further and find that ‘KSM‘ is doing really well. This is ‘Kernel Samepage Merging’, see the below. This means we are getting 60% more ram for free!
Digging some more, we find the (likely) smoking gun. Looking @ kubectl top pods, we find that the 3 tests are each using more memory (according to kube-metrics-server) than they actually are, and that when the sum of them exceeds the physical memory, one of them gets terminated by kubernetes.
So… kubernetes wants you to disable swap. its very opinionated on this subject (and we are not swapping here). But it seems to have miscalculated the ‘vm.overcommit’ and ‘ksm’ affects, thus being too pessimistic, and terminating what were otherwise happy pods.
We had another issue. Initially each pod (which is a container, which is to say, not virtualised, sees the host kernel etc) thought it had 72VCPU to play with, and went nuts in parallel. So all 5 pods running w/ 72VCPU caused some thrashing. We tamed them by capping them @ 24VCPU, ironically making it faster.
So… What is the solution? I end up with each of the parallel phases at some time thinking its using ~180GiB of ram (on a 256GiB machine). I can unparallel the stages, but that is unnecessarily pessimistic. It also means that if I grow the cluster the speed won’t increase.
Likewise I can instruct gitlab runner to cap the number of jobs, but that is very wasteful and slow.
I can continue to dig into kubelet and try and figure out why it is confused.
Any suggestions from the peanut gallery?
Leave a Reply to db Cancel reply