A lot of my background is telecom related. And one of the things telecom is very good at is alarm + fault management. Its an entire industry devoted to making sure that when something goes wrong, the right action happens immediately. That when things trend or fluctuate they get caught.
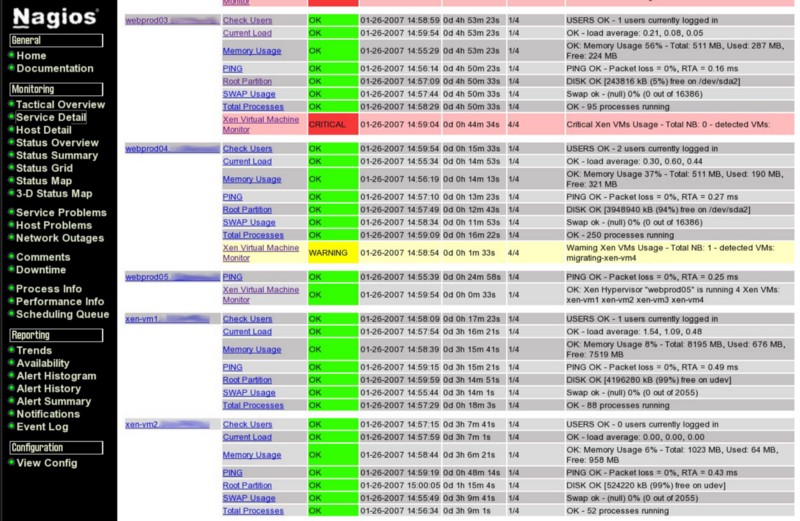
Its complex and a lot of work to integrate your new system up, you have to model all your alarms and faults, etc. But when its done, its bulletproof. And you get a UI (like on the right) where all vendors have a normalised view. The workflow is managed, trending is there, etc.
Enter the cloud. It substitutes (unformatted) logs for faults. It substitutes performance management (time-series trending) for alarms. And it pretends to be self-healing, except when its not. It substitutes volume of data for information. I want a red-light/green-light, not a sewer pipe.
Have you ever looked in your cloud logs? You’ll find such gems as:
"time="2018-09-17T12:13:43Z" level=error msg="ERROR: infiniband collector failed after 0.030957s: strconv.ParseUint: parsing "N/A (no PMA)": invalid syntax" source="collector.go:123""
OK, so what am I to do this with this? It happened a few times, somewhat irregularly. Is it a fault (a system error that clears itself when the underlying condition is removed, e.g. over-temperature) or an alarm (something I must take affirmative action and acknowledge). There’s no workflow here, i’m on my own, free-floating. The log system tells me everything, and yet also nothing.
What about this one:
"2018/09/17 12:19:26 [error] 8#8: *758040 upstream prematurely closed connection while reading upstream, client: 10.244.1.252, server: _, request: "GET /api/v1/namespaces/kube-system/services?resourceVersion=344761u0026timeoutSeconds=438u0026watch=true HTTP/2.0", upstream: "https://52.237.13.72:443/api/v1/namespaces/kube-system/services?resourceVersion=344761u0026timeoutSeconds=438u0026watch=true", host: "10.0.0.1:443""
Its all over the logs. It comes from ‘azureproxy’ which is some sort of method to get from my Kubernetes pods to the (managed) master.
And this gem. Its from heapster, which is installed as part of the managed AKS. What am I to do?
"ERROR: logging before flag.Parse: E0917 12:19:26.569980 1 streamwatcher.go:109] Unable to decode an event from the watch stream: stream error: stream ID 1499; INTERNAL_ERROR"
So now I’m left uncertain, are these ‘errors’ things I need to address? if not, what errors are? How do I filter them out? Or trend to see if they are one-of events or long term issues? As I hire more operations staff, how do I teach them to read all the various and sundry logs, I want them to look @ red/green light charts like that nagios one above.
Leave a Reply